Reading .Net Profiler traces
This blog post explains the important information of a .Net Profiler Trace data capture and helps you to identify slowness at thread level or dependency execution.
Prerequisite
You must have a .Net Profiler trace previously captured
For more information regarding capturing the .Net Profiler traces, you can refer to the below content:
Accessing the report
There are 2 ways to access the reports.
You will find them on the app’s blade following the menu below:
Diagnose and solve problems » Diagnostic Tools
- 1st – Collect .Net Profiler Trace
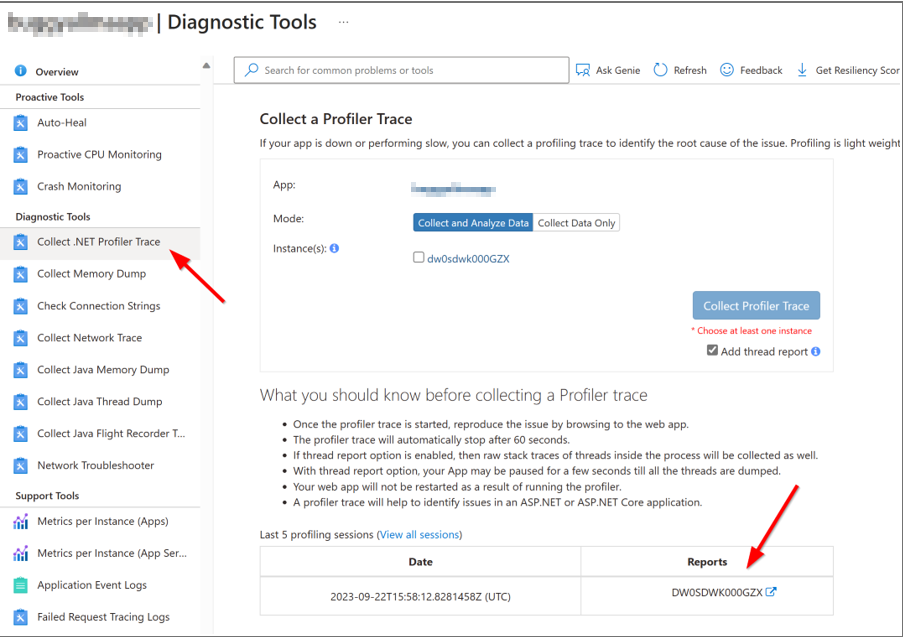
- 2nd - Auto-heal
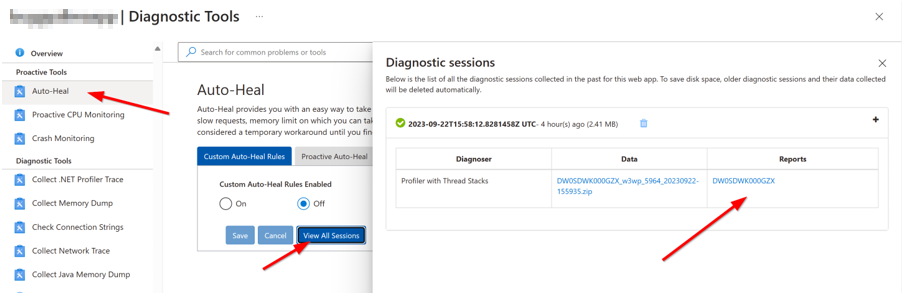
The report is created by Azure DaaS (Diagnostic as a Service) tool. It creates a .html file based on the above .zip file. The .zip file is named as shown below :
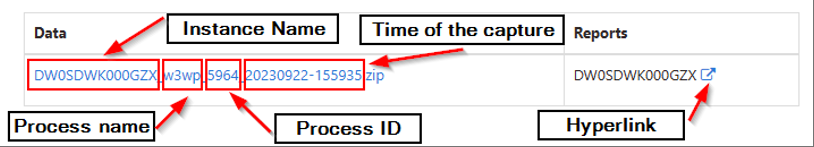
The above naming helps you to dig into the analysis related to Instance, Time frame, and if needed, process name and ID.
Report header
You can find some very helpful information to track the instance name, for how long the trace was captured and the number of requests (total, successful and failing ones). You also have some information related to the CPU load at instance level and process level.
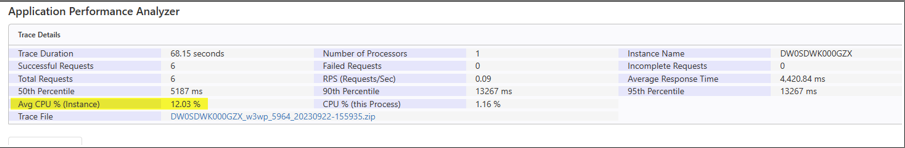
Trace Duration: time in seconds the trace was captured;
Successful requests: number of requests resulted in success during that capture from that instance;
Total Requests: total number of requests during capture from that instance;
50th percentile: average response time that 50% of the requests took long time;
Avg CPU % (instance): This is the average CPU during that time for all processes from the instance (Operating system processes + website processes); NOTE: If the avg CPU exceeds 70%, this is a potential cause of the slow request.
Trace File: source of the trace file – combination of the Instance name + process name + PID + Time of the capture compressed in a .zip file;
Number of Processors: Number of CPU cores the instance has;
Failed requests: Number of requests with failures during the capture from that instance;
RPS requests per second: number of requests/second the application got during the trace;
90th percentile: average response time that 90% of the requests took long time;
CPU % (this process): This shows the percentage of the CPU only for the process the capture was performed (w3wp.exe);
Instance name: it helps you to identify if the instance you observe slowness matches with the instance you are checking the report;
Incomplete requests: This shows the number of requests that didn’t finish during the data capture;
Average Response time: This is the number of requests split by the sum of response times of the requests (Number of requests/sum of the time taken of all requests);
95th percentile: average response time that 95% of the requests took long time.
Checking the slow requests
Once the CPU is considerebly lower, we can dig at requests and thread level.
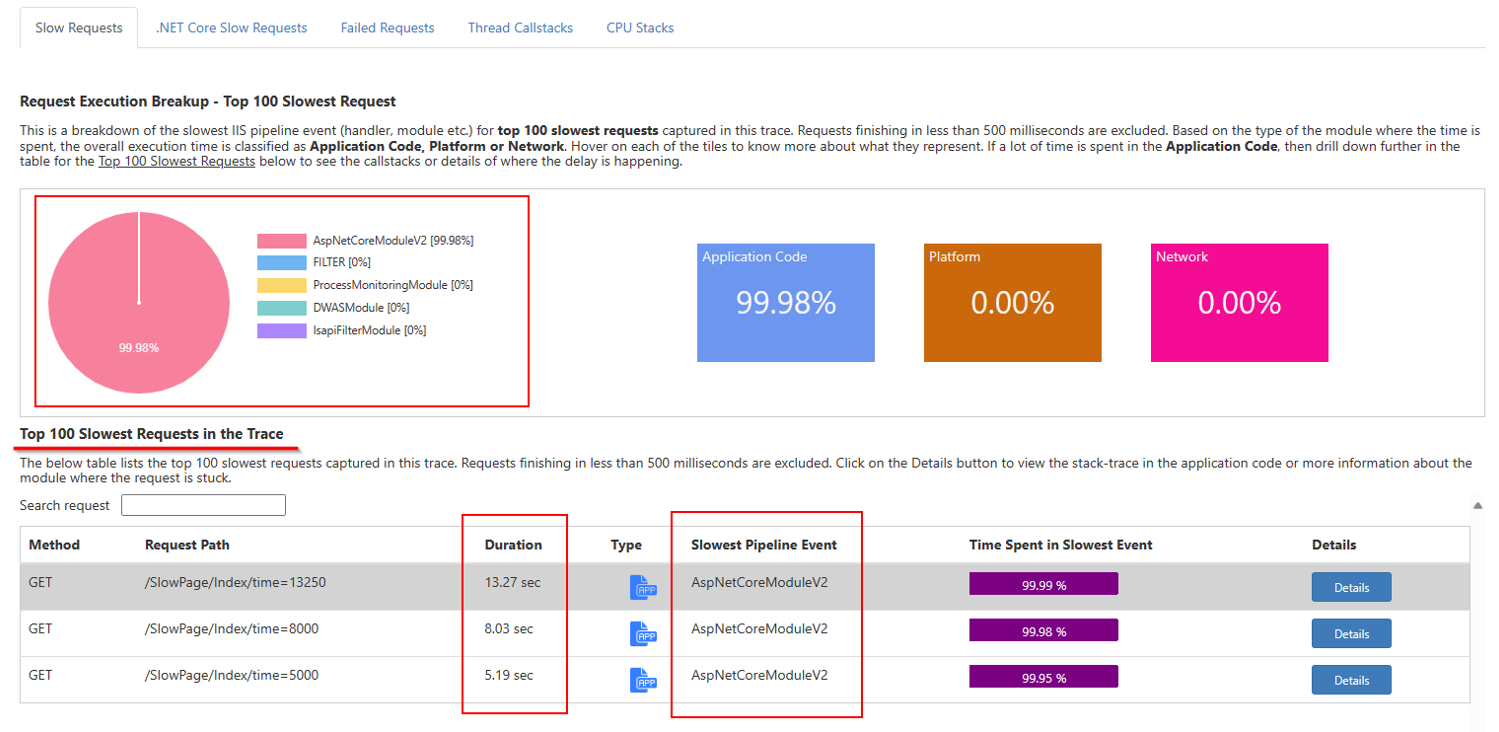
NOTE: the above “Platform” and “Network” parts are related to the worker instance your website is running. They don’t consider the Vnet or internet traffic out of the IIS instance.
The above report shows that most of the slowness comes from app’s code (AspNetCoreModuleV2). It also shows the URL and the time taken of the top 100 slowest requests.
Exploring the request at thread level
Considering it’s a .Net Core app, we must use the “.Net Core Slow Request” tab.
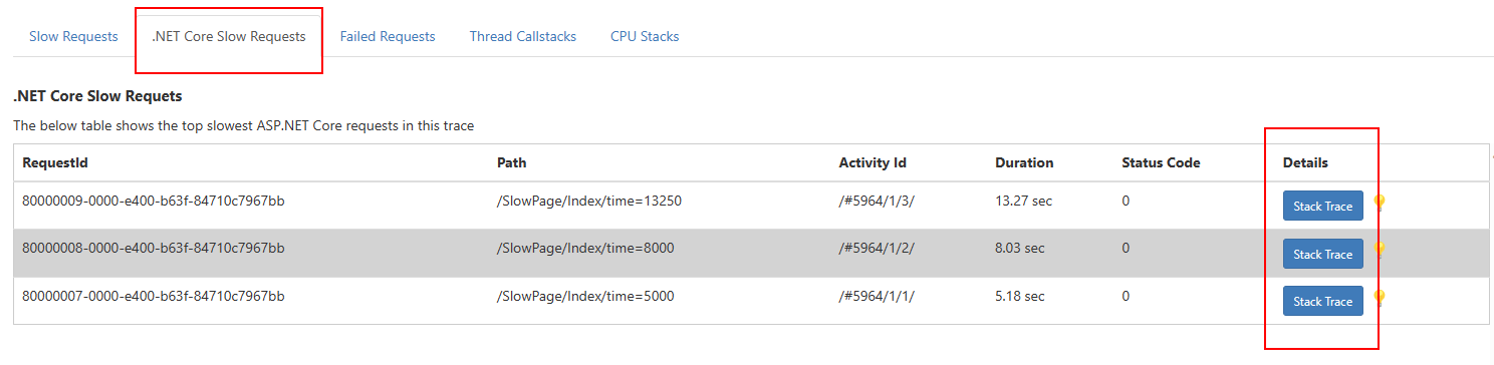
NOTE: the thread information is available only for asynchronous requests, however you still can see some information grouped by activity because the CLR uses tasks and groups them by tasks.
Once we click on the “Stack Trace” it will open the request at thread level showing the threads, the time spent.
It’s important to look for the activity with long time taken.
- BLOCKED_TIME
This means the thread is waiting for something to continue processing the request.
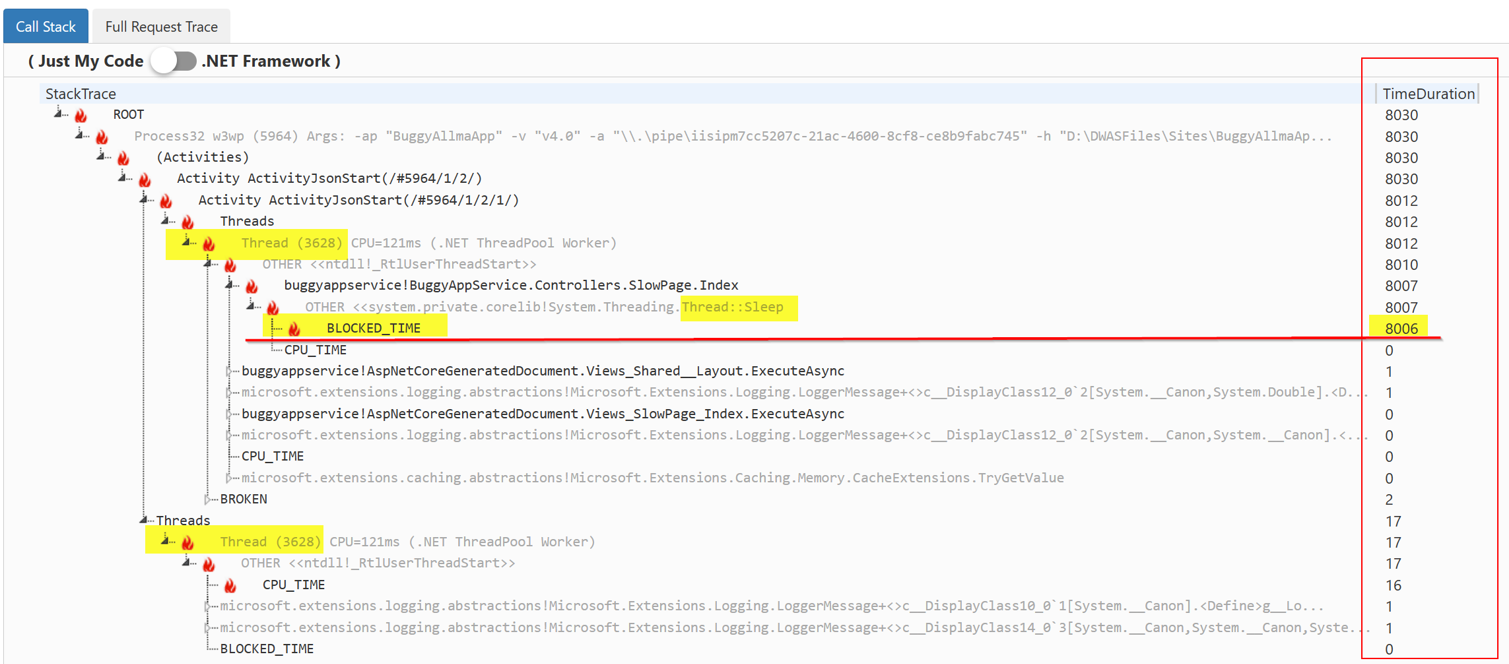
NOTE: the above lab was intentionally calling “Thread.sleep” for 8 seconds.
We see the thread spent 8006 miliseconds in BLOCKED_TIME.
If your request is related to a dependency (database or other service/site), that means the thread is waiting for data to be returned, and then, continuing to process the request. Notice after 8006 miliseconds, the IIS pipeline processes the request quickly (from 8006 to 8030 miliseconds)
- AWAIT_TIME
You may see part of the time taken in the above status. This is not common in production workloads, however, if you see that, that means the app has an explicit call for waiting specific time to continue processing the request.
- Empty Stack Trace
There are some few scenarios where the stack trace details will not be available.
-
the request didn’t finish in that profiler trace capture
-
request stuck in ASP.Net Session State module - this can be for several reasons:
- Multiple requests using the same session ID
- Storing session OutProc session store (SQL, Redis cache) and the session provider is introducing delays.
CPU Stacks tab
Using this tab, you can identify which processes and threads are consuming more CPU.
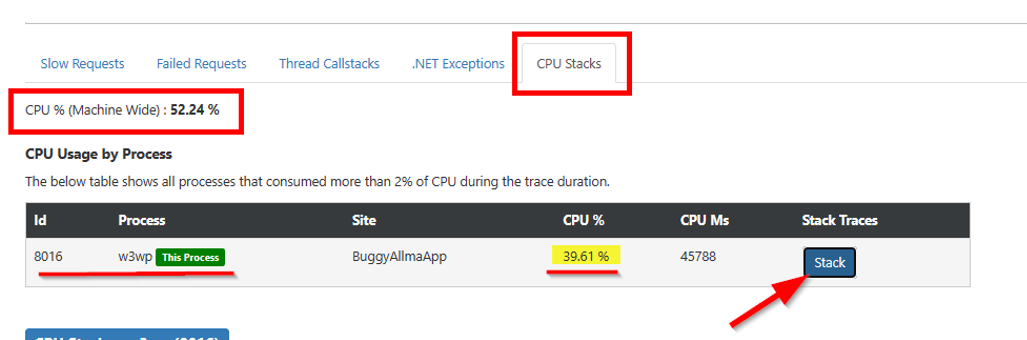
The above screenshot shows us the CPU at machine level and the process consuming more CPU at that time.
Exploring the Stack, it shows you the code related to that part and the CPU percentage.
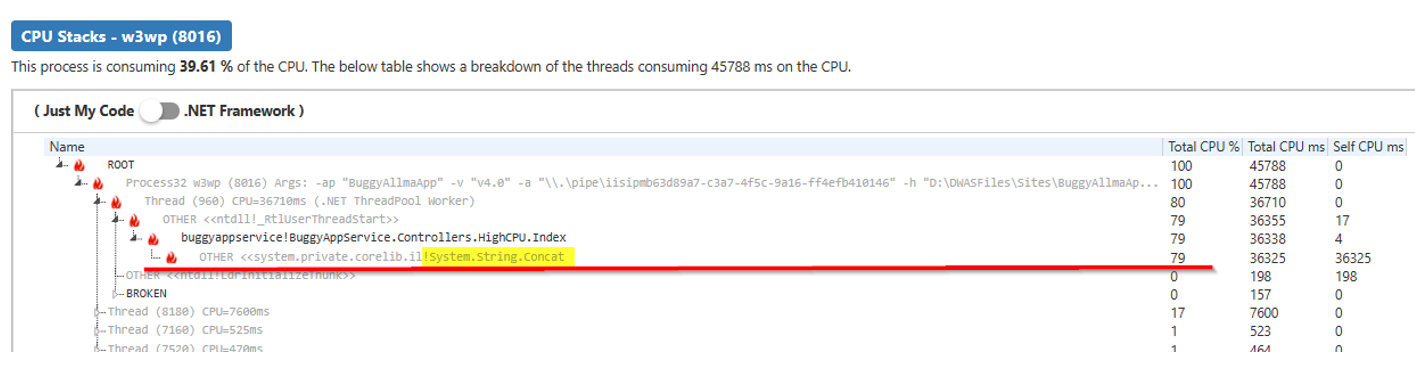
Here in this lab, we see the String.Concat was the cause of the high CPU – 79% of the CPU from that Process ID that time was from that method.