Identify and Diagnose High Memory issues on Azure AppService (Windows)
What are the limitations of physical RAM?
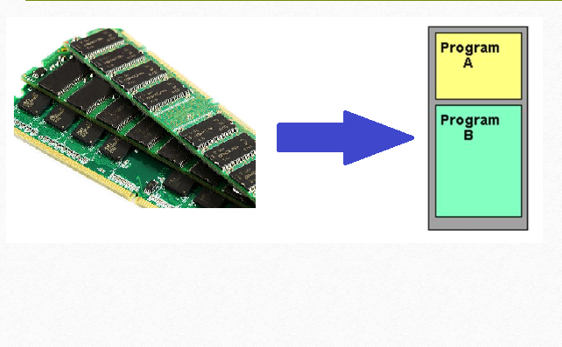
Your computer has 2GB of RAM installed. You just ran a SQL query which demanded 500MB to store the results. If Windows was limited to using only the computer’s physical RAM, you would be in trouble because Windows 10 requires a minimum of 1GB of memory itself, and SQL is going to use a bit in addition to the very large chunk of data it’s holding on to. That doesn’t leave much room in physical RAM for anything else. How will I run Outlook for email? Or One Note?
Virtual Memory
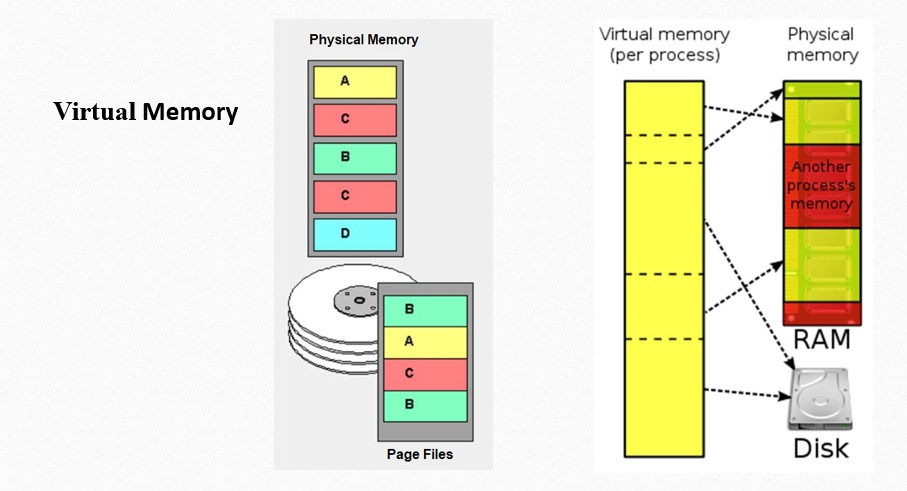 Windows uses the hard drive for help.
It uses a portion of the empty space on the hard drive to temporarily hold the data that would otherwise be held in your computer’s memory.This physical memory and the hard drive space are known as virtual memory.
Your programs don’t know that they’re using virtual memory — Windows takes care of everything behind the scenes.
Windows will allocate a specific amount of virtual memory to each application.
Windows will then keep track of what’s in physical memory vs what’s in virtual memory.
Windows uses the hard drive for help.
It uses a portion of the empty space on the hard drive to temporarily hold the data that would otherwise be held in your computer’s memory.This physical memory and the hard drive space are known as virtual memory.
Your programs don’t know that they’re using virtual memory — Windows takes care of everything behind the scenes.
Windows will allocate a specific amount of virtual memory to each application.
Windows will then keep track of what’s in physical memory vs what’s in virtual memory.
The area of the hard disk that stores the RAM image is called a page file. It holds pages of RAM on the hard disk, and the operating system moves data back and forth between the page file and RAM.
Memory Management Fundamentals
A process in Windows asks for the memory it needs as it needs it . It doesn’t start off with everything it needs. Memory is managed at page size granularity. The page size is defined by the hardware and normally 4KB. Allocations will happen on 64kb boundaries. And that’s important as this can cause gaps in the memory. If you allocate 4K the remaining 60 KB is wasted. Committed means it is in use and represents some data the process is using. It is represented by the Commit Size. It includes RAM plus pagefiles. Reserved is placed aside for future use. It can be later committed. It can’t be allocated again.
Private Bytes are what your app has actually allocated. Private bytes are not exclusively physical memory; they can be paged to disk. The Working Set is the non-paged Private Bytes.
What is a memory leak? It is memory that has been committed or reserved but it is no longer needed or used but it has not been released.
Should we be watching the private bytes as an indicated of memory leaks? Yes, when private bytes continue to grow it can indicate a memory leak but it is not a definitive indicator as there are other reasons private bytes may continue to grow in an app service. Further analysis is needed.
Reference: https://docs.microsoft.com/en-us/dotnet/standard/garbage-collection/fundamentals https://docs.microsoft.com/en-us/dotnet/standard/garbage-collection/large-object-heap
Process Bitness:
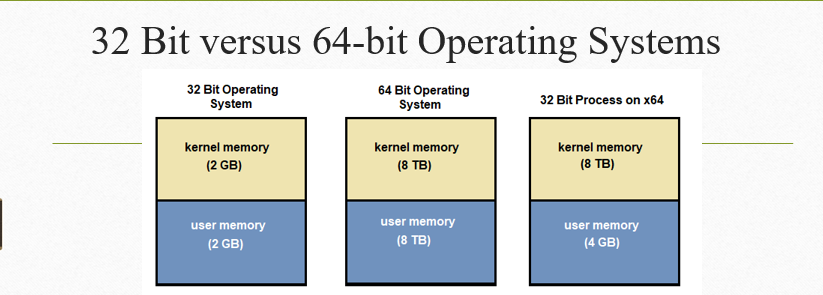
The second important thing to understand is what is the process bitness i.e. 32 bit or 64 bit as that plays a huge role when we talk about memory.The bitness of an operating system is referring to the size of its memory addresses. For 32 bit, the memory addresses are 32 bits. For 64 bit, the memory addresses are 64 bits.
Now obviously everything comes down to the single bit, and a byte is still 8 bits. But in a 32-bit system, memory addresses use 32 bits to describe a single memory location – a bit. So that means a processor with 32-bit memory addresses can directly access at most 4 GB of byte-addressable memory All processes are assigned a virtual memory space of 4 GB, regardless of how much RAM is actually installed on the computer. This 4GB is divided equally between kernel memory and user memory.
A processor with 64-bit memory addresses can directly access 16 exa-bytes. For 64bit, this process virtual memory space is 16 TB. This is because Windows limits the 64-bit addressable memory to 16 TB. This 16TB is also divided equally between kernel memory and user memory.
When we run 32bit processes on a 64bit OS we get the 8 TB for the kernel and an increase to 4 GB for user memory
Simplistically, kernel memory is where the kernel runs, and user memory is where the user applications run. User memory is basically a form of sand-boxing – it restricts user programs so they can’t mess with memory (and other resources) owned by other programs or by the OS kernel. This limits (but usually doesn’t entirely eliminate) their ability to do bad things like crashing the machine.
The kernel is the core of the operating system. It normally has full access to all memory and machine hardware (and everything else on the machine). To keep the machine as stable as possible, you normally want only the most trusted, well-tested code to run in kernel mode/kernel space.
What is High Memory in App Service (Windows):
A 32bit application has a total memory size limited of 2GB. When an application approaches 60% of the total amount of memory available, it will start being sluggish. This can be due to more pagefile swaps and/or more garbage collections are executed to free memory.
If memory usage continues to grow, at around 85 to 95%, the application will throw an out of memory exception and crash.
A 64 bit application has a much larger footprint of available memory to execute within – 8 TB. However, in practice, the application isn’t actually able to utilize 8 TB. Instead, it is governed by the physical RAM and the physical hard drive space configured for the pagefile.
The 32bit rule is that the pagefile should be 1.5 or 2 times the amount of RAM installed. This still holds true for 64bit systems when the RAM is small – less than 4GB.
A Standard S1 has 1.75 GB of RAM. Focusing on just physical RAM, at approximately 65%, or 1165 MB, the application will start performing poorly.
Also, remember, on a small S1, 50 % of memory might be consumed by the processes or services running for the operating system That is the base memory usage for Windows processes running on the machine.
That leaves a small memory footprint for your application.
Common Causes of High Memory:
- Too many objects created and not released
- Too many Static References
- Too many string concatenations
- Large DataTables
- Storing large amounts of data in Session or Application State
- Regular expression matching of very large strings
- Running in Debug mode
- Throwing a lot of exceptions (and handling them)
Refer for more details : https://blogs.iis.net/webtopics/troubleshooting-system-outofmemoryexceptions-in-asp-net
Troubleshooting High Memory:
- If the high memory process belongs to the single webapp process:
- Capture multiple Memory dumps using memory limit condition via AutoHeal
- If high memory is not due to one single webapp, but it is a combination of many apps or services
- Move some sites to a different app service plan or Scale Up
Procctive AutoHeal is an extension to the auto healing feature of Azure App Service. It will only take corrective actions for the sites that Azure has deemed to be in a bad state. Proactive Auto-Heal will monitor for high memory and recycle the app when this conditions is met.
